If you have a mood disorder (such as Dysthymia, Bipolar Affective Disorder, Major Depressive Disorder, or Premenstrual Dysphoric Disorder) there is a brief daily activity that I strongly recommend you try. Keeping a mood chart is a deceptively powerful exercise that can benefit anyone with a mood disorder.
You and your treating team can notice patterns
Charts can reveal a relationship between your mood and other variables such as sleep, exercise, alcohol use, medication changes, and menstrual cycle. Taking your mood chart to appointments with doctors and psychologists can help them understand, without you trying to remember and describe how you’ve been going. This is particularly useful because mood disorders commonly cause difficulties with memory and concentration.
Learn how to observe your moods as well as experience them
Ticking boxes and entering numbers into a mood chart helps you take the position of a scientist or journalist observing your mood. Being able to observe your moods as well as experience them helps important areas of your brain start to communicate better with each other. This helps you generate more objective thoughts and even use lateral thinking to help solve your problems. It gets your brain moving towards functioning the way it does when you are well.
Combat mood dependent memory
The human mind is prone to mood dependent memory, which means that our moods dictate which memories we can access most easily. When you’re happy, it is easy to recall other happy times. When you are depressed, it becomes very difficult to remember the happy times. This can slow down your recovery because you tend to think things like “I’ve been depressed for so long maybe I’ll never feel better.”
If you have been completing a mood chart you can quickly and easily look back and see the evidence that you’ve had happier days. You can then use this to challenge the negative thinking that comes with depression.
Getting Started
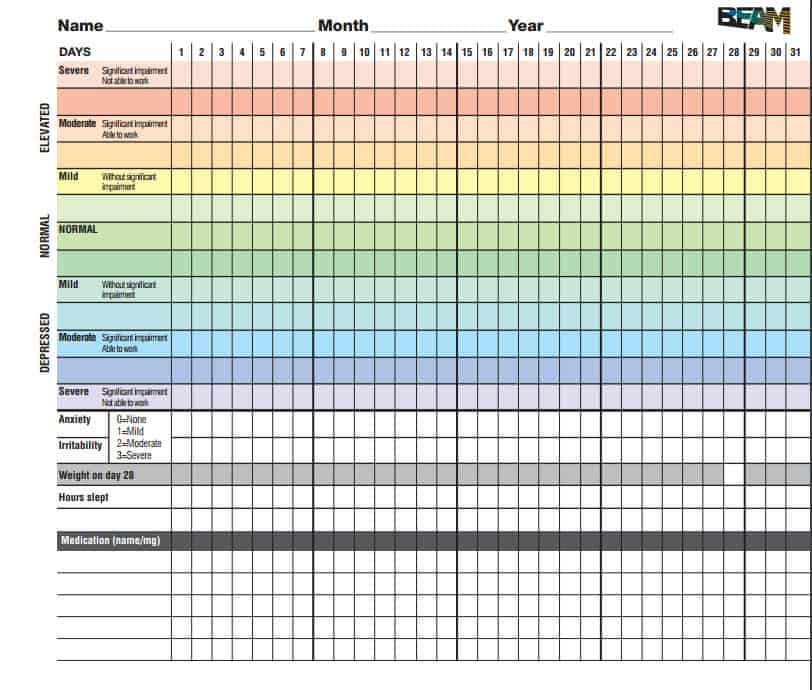
If you are interested in doing a mood chart, you can download one I routinely use with my clients here, and start completing it following these steps:
- Choose a time near the end of each day at which you will be able to consistently complete the chart. You may need to set an alarm, or keep the chart near something you predictably use in the evening (like your toothbrush).
- Firstly, write the month and year at the top of the page and start entering your ratings for today under the number corresponding to today’s date.
- Mark the box that represents your average mood for today (ranging from severely elevated to severely depressed).
- If your mood fluctuated significantly over the course of the day, you can mark two boxes. For example, one day you might mark both “normal” and “moderately elevated”; another day you might mark only “mildly elevated.”
- Next, rate your average irritability and anxiety for the day using the rating scale provided (0=none, 1=mild, 2=moderate, 3=severe).
- On day 28 you can record your weight if you choose to. This is because mood disorders can cause weight changes.
- In the row marked sleep, enter the number of hours you slept LAST night.
- Under sleep there is a blank row, which you can use for tracking another variable if you like. This can be used for anything that you think cold be related to your mood and can be expressed with a number or a tick/cross. Some examples are naps, meals, binge eating, standard drinks, or arguments with your partner.
- The final step is to record your current medications and doses. If your dose changes, enter the new dose into a new row and start marking the boxes for that row instead. This makes it easier to track any mood changes after a medication change.
- On the back page you can use the notes section to add information that can’t be communicated using a number or tick/cross system. For example you might write the details of a significant event that you think could have had an impact on your mood. There is also additional space on the back page for medications.
- At the end of each month, you might like to create a line graph by drawing a line between your mood ratings. If you have been marking two boxes per day, draw two line graphs.
If you forget to complete the chart at times, do NOT fill it in later as your memory will not be 100% accurate. A mood chart with gaps (even large gaps) is more useful than an inaccurate one.
A quick note for women: I advise women with menstrual cycles to circle the first day of their cycle so that they can track any hormone related mood changes. If you know when you ovulate it can be useful to chart that as well because ovulation can affect moods.

BA(Psych/Psychophys), Hons (Psych), MClinPsych, MACPA
Sarah has been practicing as a clinical psychologist in private practice and in public mental health settings since 2004. She sees adult clients at Wheelers Hill Psychology.